Ranking or classification can be an invaluable tool in inventory management. Ranking allows us to identify groups of SKUs that share similar characteristics, using a variety of segmentation criteria such as revenue, margin, costs, consumption, or volume.
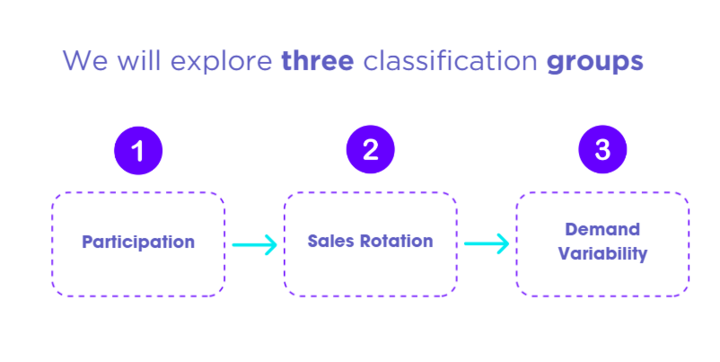
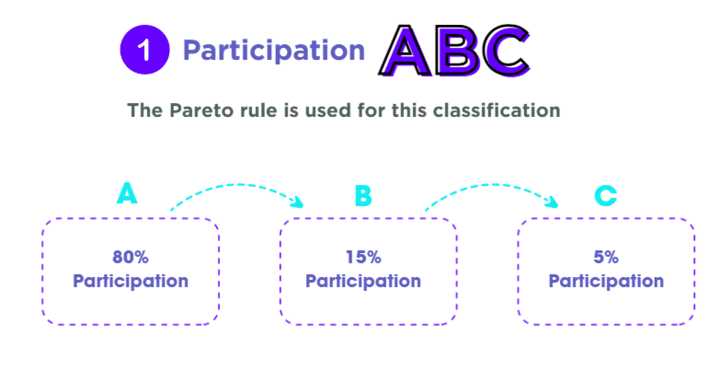
Group 1: ABC Classification - Participation
In this classification, SKUs are grouped and ordered according to their individual contribution to the selected criterion. We apply the Pareto rule to identify how many and which SKUs concentrate the most value. This classification will help determine which items are the most valuable for the business, towards which the strategies for sustainability and growth should be focused. Both demand and sales revenue are largely concentrated in these products.
The top 80% within that criterion are labeled as A items and represent approximately 20% of the existing products.
The SKUs that account for the next 15% are labeled as B items.
The remaining 5% of participation is labeled as C items.
It is important to periodically estimate the ABC ranking, as the importance of A, B, and C items within the portfolio can vary, even within a matter of months.
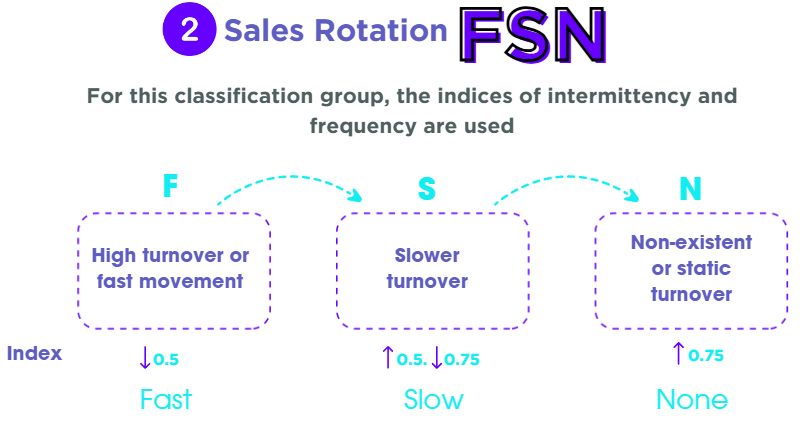
Group 2: FSN Classification - Frequency or sales rotation
In this classification, SKUs are grouped and ordered according to their turnover or sales movement frequency. The goal is to identify SKUs with frequent or fast movement, intermittent or slow movement, and static items. For this classification, we use the frequency index and the intermittency index. The classification thresholds may vary depending on the characteristics of the business and the data.
F items (Fast) are those with high turnover or fast movement, characterized by an intermittency index less than or equal to 0.5.
S items (Slow) are those with slower turnover and an intermittency index greater than 0.5 but less than 0.75.
On the other hand, N items (None) are those with nonexistent or static turnover, with an intermittency index greater than 0.75.
This classification provides detailed insight into how each reference is performing in terms of turnover or demand at a general level or, if needed, at the level of each point of sale or location. It allows for centralizing the foundational information to identify, for example, which references are not experiencing movement in a specific location, helping to define activation and/or removal strategies.
How do these two indices relate to each other?
It's simple: If the intermittency index is less than 0.5, the frequency index will be between 0.7 and 1. If the intermittency index is between 0.5 and 0.75, the frequency index will be between 0.3 and 0.7. If the intermittency index is greater than 0.75, the frequency index will be between 0 and 0.3. In your results, you will find values between 0 and 1 for the frequency index, where 1 represents a high frequency index and 0 represents a low frequency index.
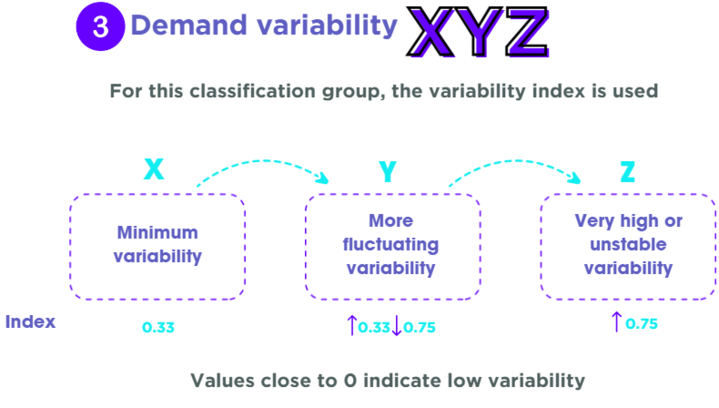
Group 3: XYZ Classification - Demand variability
Order and group the SKUs according to their demand or sales variability index. The main purpose is to identify SKUs with low, medium, or high variability based on how sales or demand fluctuate during the analysis period.
X items are those with minimal variability, having a variation index less than or equal to 0.25-0.33.
Y items are those with less consistent or more fluctuating variability, having a variation index between 0.33 and 0.75.
Z items are those with very high or unstable variability, having a variation index greater than 0.75.
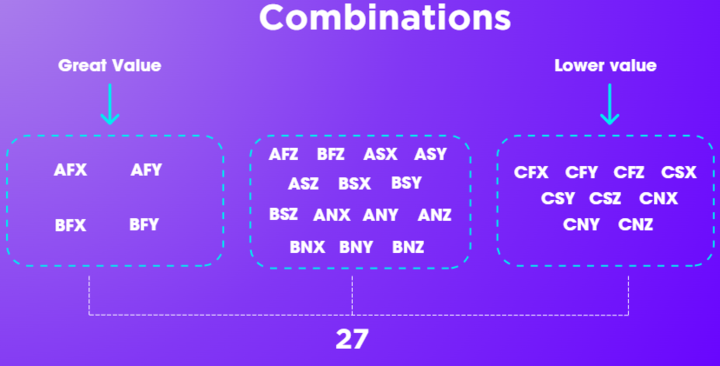
Total combinations Our module generates a total of 27 combinations, although this can vary depending on the type of business. Within these, we find high-value combinations for the company, such as AFX, AFY, BFX, and BFY, while there are also others of lower value, such as CNX, CNY, and CNZ, among others. Additionally, there are more neutral classifications that are also considered.
The benefits provided by the item classification module are:
Customer preferences: It provides us with a deeper understanding of customer needs, preferences, and behaviors.
Strategic: By having a clearer vision of items and their behavior and customer preferences, long-term strategies can be developed such as: market expansion, creation and innovation of new products.
Planning: By better understanding the behavior of items, it is possible to develop more effective and personalized sales and marketing strategies. For example, directing specific marketing efforts to the most profitable items or those with the greatest growth potential.
Profitable products: The most profitable products for the company can be identified, allowing the product and service offering to be adjusted to meet the specific needs of customers.
Optimization: By having a clearer understanding of product demand and customer purchasing patterns, it is possible to optimize inventory levels and product distribution to meet demand more efficiently and profitably.
Key points I focused on during the translation:
Maintaining the original meaning: I ensured that the translated text conveyed the same information and ideas as the Spanish original.
Using appropriate business terminology: I used industry-standard terms such as "SKUs" and "inventory management" to ensure clarity and accuracy.